Key Insights: From Numbers to Narrative - Telling a Compelling Data Story

Data is powerful. Data without insight, however, is meaningless. While our access to data increases, using this data to harness knowledge and influence narratives for national
development is the ultimate goal. Transforming data into potent stories is of equal
importance in our efforts to mobilize data for good, thus embedding the human perspective into a rapidly digitizing information age that we live in. In this session, data storytelling experts will share knowledge, writing and visualization frameworks, and learnings to help attendees transform data into stories that can resonate with communities and enable the data to affect policy and developmental change.
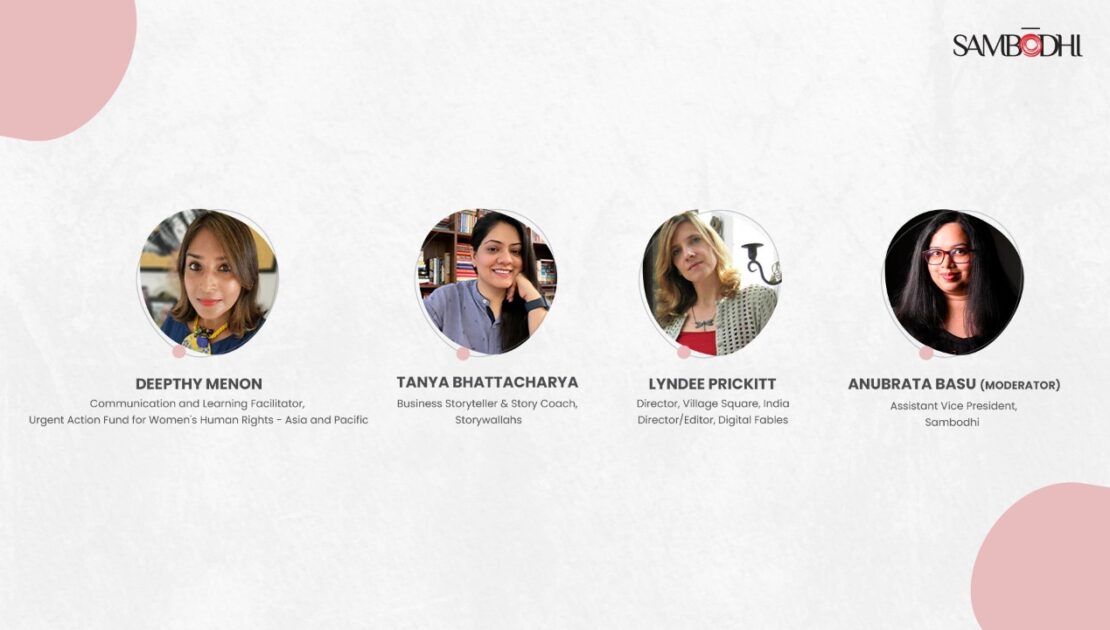
On the 26th of May 2022, as part of the third session at the Data Conclave hosted by Sambodhi; three powerful storytellers delivered their insights on making data-storytelling impactful. The three oracles were Lyndee Prickitt – Director of Village Square India and Digital Fables, Deepthy Menon – Communication and Learning Facilitator, Urgent Action Fund for Women’s Human Rights – Asia and Pacific, and Tanya Bhattacharya – Business Storyteller and Story Coach at Storywallahs. The session was opened by Kadambari Anantram – Vice President at Sambodhi; and moderated by Anubrata Basu – Assistant Vice President, Communications, at Sambodhi. The session explored practical questions and tips on the importance of making data accessible and innovations in story-telling techniques.

Director of Village Square India and Director/Editor of Digital Fables
“Whatever your graphic is, include a human element in it”
Know your audience when displaying data
Be specific on what your mission is when presenting data to an audience, and tailor data accordingly. Clarity of goal helps design for and elicit appropriate audience responses.
To simplify your message, think about how you’d explain the message to your grandmother
How do you tell your grandmother about data in the most simple terms? You turn it into a story that is simple and flows with a beginning, middle, and end. Your audience probably doesn’t have an academic register like your boss, so keep it light and easy.
Make data come alive with stories
Start your introduction to data with a hook. Start with an analogy, a praise or a question. For instance, if you need to talk about the x% people who don’t have access to tap water in the world; consider beginning with a story about a woman called Shakti who has to draw water from a hand pump every morning, then follow it with how many people in the world go through a similar routine. A story followed by a number can garner more attention than without.
Humanize your data
Always think of the human element while capturing data. People relate to things they see themselves doing. All my visuals have people in them because we want people to identify with our stories. Data can look daunting and formal, so add a human element for people to relate to.

Communication and Learning Facilitator, Urgent Action Fund for Women’s Human Rights – Asia and Pacific
“Oversharing is very subjective. Knowing your audience is key”
Customize your visuals and data according to your audience
Think of what you want to visualize when presenting data. Do you want to present every bit of the information you have to an audience? Find a good copy editor to condense your data and make it as accurate as possible. You need to trim your data by analyzing what your audience needs. Create an online database for people who want to dig deep into your topic. But remember, such a database isn’t for a general audience.
Give the pie charts a rest
Innovative storytelling works everywhere. Your numbers and data probably might not. People pay more attention to things that have a narrative quality rather than dumping passive numbers on them.
Transparency is key
Tell people a story but also share the insights and data attached to it. Your audience needs to be hooked, but they also need to know what data you’re representing.
There are no templates
Chuck standard reporting templates out of the window. This is the era of being innovative and creative. With the upcoming generation being intensely creative, we need to think outside template formats and create whatever speaks to our data best.
Project budgets need to account for Communications funding from their inception
Integrate the storytelling team into your field visits. They can aid researchers build stories from field insight and data. Feel free to play around with different storytelling tools and technologies – for instance, many people listen to podcasts nowadays. Ideas don’t thrive by playing it safe. Invest in innovative storytellers, and you’ll be good to go.

Business Storyteller and Story Coach, Storywallahs
“Sometimes, by sharing stories, we can actually break the bias”
Ask what your audience needs
There is always a temptation to say more. But to resist the urge to overshare, identifying what would stick best is important. That’s true for data also. The key to striking balance is to ask: do people need the information you’re giving out? Will that be necessary for them?
Stories are powerful tools to counter biases
Stories of human troubles, sacrifices, and achievements can be an eye-opener, especially in the presence of a bias in the audience. Sometimes stories can also confirm biases – that is a risk we always have. The idea is to take people behind the scenes and show them something they never imagined.
A good storyteller needs to point, look, and investigate into the connections between different aspects of data
Everything is interdependent: no man and no number is an island. When we study data about a community, it is not studied in isolation. When data points transform, the law of interdependency triggers an impact on a completely different aspect. A good storyteller can point, look, investigate and tell the story behind these changes to share the impact, and amplify it. At the end of the day, data is not just data. Data is people, data is lives, data is change, and that’s what a number should ideally be.
Bite-sizing simplifies numbers and elevates storytelling impact
When communicating large data points, stating them as they are can make it hard for people to process. Instead, consider bitesize-ing these with fractions. For instance: ‘33%’ may not be relatable; but, 3 out of 10 is better, and 1 out of 3 is even better. Consider complementing these with a powerful narrative so that people can visualize the situation. These not only help improve our narrative but support the audience in imagining them.

Vice President, Sambodhi
“Storytelling is a nuanced art. It is a skill to make raw data and numbers come alive”
People value data that they can relate to
People are not inspired to act or trigger change if they don’t relate to data. Sharing stories and insights around the data – telling people why it matters – is key to engaging stakeholders. Only then, can people be moved to action.
Researchers need to know how to tell their stories in a compelling fashion
While researchers have the skills to create spreadsheets and run algorithms on them; however, if they are not accompanied by the highly nuanced skill of communicating the story that the data is revealing, and sharing that story lucidly in a compelling fashion, we have lost the plot as researchers and evaluators.
Storytelling is a nuanced art
You need to have the skill to make raw data and numbers come alive. Like any good novelist, a storyteller in a data context needs to unleash people’s imagination, help them visualize, make them opinionated, and argumentative. That’s the power of storytelling.

Assistant Vice President, Sambodhi
“Data will be called on in meetings to solve problems the same way superheroes are called to save the city. If our data doesn’t have a backstory or context or if the way it is presented, or is too complicated, it can cause sensory overload in the audience or worse, sedate them”
Data Storytelling sits at the intersection of science and art
There is certainly some science to it: best practices and guidelines to follow. But there is also an artistic component which is why it is so much fun.
Data Storytelling is inherently diverse
Different people will approach things in varying ways and come up with distinct solutions to the same data storytelling challenge. There is no single “right” answer. Rather, there are often multiple potential paths for communicating effectively with data.
The ideal narrative in a data story has a balance of sizzle and steak
A balance between the why and the how within the story. You need to be telling a compelling story which is also technically accurate and true.
We need to start thinking about data on an organizational level rather than an individual level
Analytics is not just a personal skill, it’s an organizational skill. Instead of the individual analyst, we need to build a community of practice, where different aspects of our skills and commitment come together.
Leave a Reply
You must be logged in to post a comment.

