Triangulation is a powerful research method used to validate and strengthen research findings, using multiple techniques to investigate a research question.
Read More


Triangulation is a powerful research method used to validate and strengthen research findings, using multiple techniques to investigate a research question.
Read More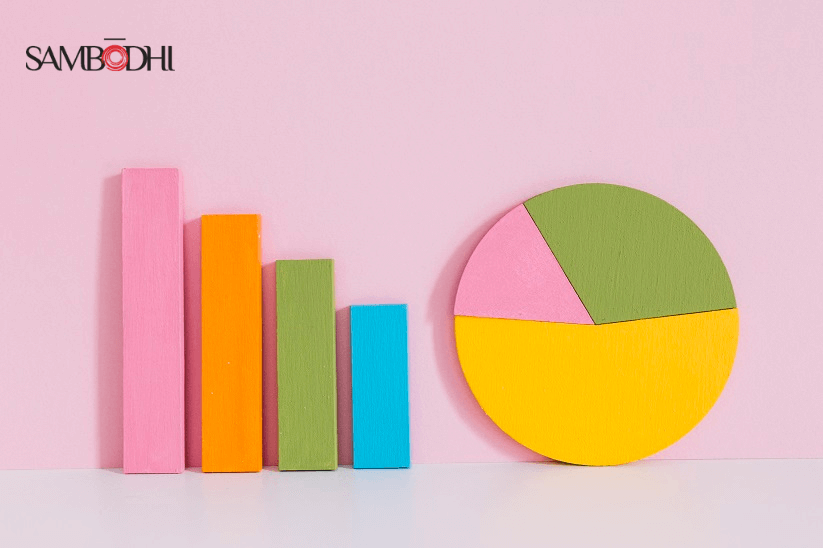
Graphs and charts help us make educated decisions and solve problems when data is presented clearly and concisely. The pie chart is one example.
Read More
Theory of Change (ToC) is a powerful tool that helps organizations and individuals understand how their efforts can lead to a desired outcome.
Read More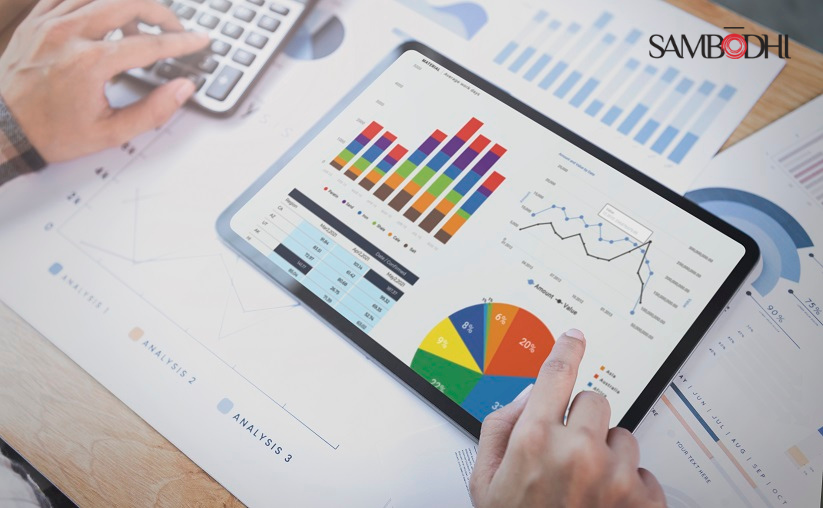
Cost-benefit analysis is a technique that is an indispensable business analytics tool based on a data-heavy research model.
Read More
When you have a data set, it's important to understand what it represents and how it behaves by looking at the measures of central tendency.
Read More
With the amount of data available today, finding tools that help organize the data is crucial, one of them being word clouds.
Read More
Visualization is not a new trend: it has existed since the advent of human existence in this world.
Read More
Did you know that people tend to classify themselves as either visual or verbal thinkers?
Read More
We frequently employ interrupted time series as an evaluation approach to create counterfactuals for impact evaluation.
Read More