Effect size: The Concept and Application

Effect size is an important statistical concept used extensively in assessing the size of an intervention. Before we discuss it further, let us understand p-values.
P-values are important in determining if something is significant, whereas effect size assesses the impact’s magnitude. A p-value indicates how certain we are that something is connected to something else or that two groups are distinct. Still, it does not indicate the magnitude of the difference or the strength of the relationship, which is what effect size accomplishes.
Let’s take the discussion further and explore the concept through correlation coefficients.
Correlation coefficients are the simplest sort of impact magnitude that we can explore. Let’s take an example of an intervention wherein skill-based training improves employability. Looking at the success of the training, we can assess the increase in employability of income after the training and its correlation with the training received. We can use Pearson correlation to assess it using the correlation coefficient, defined as a measure of the magnitude of the effect. The larger the coefficient, the greater the influence on individuals or effect size.
A second way to measure impact magnitude is to compare two groups.
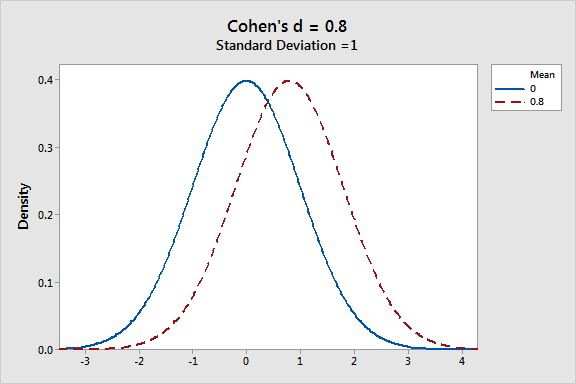
Let’s take the same example wherein training is provided to one group. Initially, there is no difference between the two groups. Hence, neither group is superior to the other beyond what chance dictates. After a few months, we compare the two groups’ employability. We can use a statistic called Cohen’s d, which indicates the magnitude of the difference between the two groups. For instance, it indicates the magnitude difference between the two groups that received the training. It is accomplished by subtracting the first mean from the second mean and then getting a standardized value. Herein, Cohen’s d is the second impact magnitude measure, quantified in terms of standard deviations.
Simply put, the effect size is a technique of quantifying the amount of difference between two groups in a normalized manner. A d of 0.5 indicates a 0.5 standard deviation difference between the two groups in quantifying and interpreting effect size. In contrast, a d of 1 indicates a 1 standard deviation difference between the group means. Classifying it further, a value of 0.2 denotes a small effect size, 0.5 denotes a medium, and a value of 0.8 denotes a large effect size.
Additionally, when we combine studies, we can combine them into an R or a D and average them out to determine the overall impact when many studies are compared.

Other Measures of Effect Size
There are also other measures of effect size one can employ. The section below provides details of some of the other measures of the effect size:
Glass’ △: This is an estimator of the effect size that uses only the standard deviation of the control group, defined by
△=X1¯−X2¯/S2
where X1, X2, and S2 represent the mean of Group 1 and the mean and standard deviation of Group 2, respectively.
Glass suggested that if many treatments were compared to the control group, utilizing only the standard deviation computed from the control group would be preferable so that effect sizes would not vary in the presence of equal means and variances.
Hedges’ g: Hedges’ g for the effect size using standard mean difference is given as
g=J×d
where J is estimated as
J=1−34df−1,
where df is degrees of freedom and d is the Cohen’s d obtained using the equation.
It is important to point out that Cohen’s d and Hedges’ g pool variances are based on the assumption of equal population variances. However, g pools using n – 1 for each sample instead of n yield a more accurate estimate, especially as sample sizes decrease.
Kultar Singh – Chief Executive Officer, Sambodhi
Leave a Reply
You must be logged in to post a comment.
