About the Index for Consumer Sentiment longitudinal track
The Michigan Consumer Sentiment Index was created in the 1940s by Professor George Katona at the University of Michigan’s Institute
for Social Research. His efforts ultimately led to a national telephone survey conducted and published monthly by the university. The survey queries consumers on their views of their own personal finances, as well as the short-term and long-term state of the U.S.economy. The present survey follows the same methodology. Because consumer spending accounts for about 63.3% of the nominal GDP (Dec 2022) of India, this Index of Consumer sentients can be regarded as one of many important economic indicators followed by businesses, policymakers, and participants in the investment community.

Dipping Consumer sentiment arks the closing half of 2022
What is consumer sentiment?
Consumer sentiment is a statistical measurement of the overall health of the economy as determined by consumer opinion. It takes into account people’s feelings toward their current financial health, the health of the economy in the short term, and the prospects for longer-term economic growth, and is widely considered to be a useful economic indicator. The Consumer Sentiment Survey in India is a big survey with a sample size of 15,514 in R1 and 14,055 in R2 ), as against a sample of 500 as practiced in the USA) covering both urban and rural India.
The survey follows the methodology of Michigan University’s survey of consumers which they have been carrying out in the US since 1972.
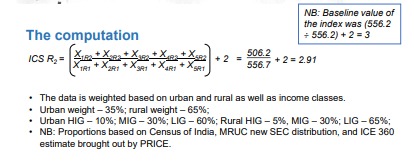
To calculate the Index of Consumer Sentiment (ICS), we need to first compute the relative scores (the percent giving favourable replies minus the percent giving unfavourable replies, plus 100). We then round each relative score to the nearest whole number and sum the five relative scores and sum the five relative scores and divide by the Round 1 (June 2022) base period total and add 2.0 (a constant to correct for sample design changes of the Michigan University ICS from the 1950s). The latest round of the India survey, conducted in December 2022, is the second round of the ICS.
The theoretical construct of the Index of Consumer Sentiment encompasses the following indicators:
X1 = Looking back, would you say that your (and your household’s) current financial situation these
days was better off, about the same, or worse off as compared to last year?
X2 = Looking ahead, do you think that a year from now, you (and your household) will be better off
financially, or worse off, or just about the same as now?
X3 = Now turning to the economic conditions in the country as a whole, do you think that during the
next twelve months we’ll have good times financially, or bad times?
X4 = Looking ahead, which would you say is more likely to happen – that the country as a whole will
have continuous good times during the next fiveyears or so, or that we will have periods of
widespread unemployment or depression, or will the situation continue to get worse as time progresses?
X5 = Generally speaking, do you think now is a good or bad time for people to buy major household items
like new furniture, a refrigerator, a new TV, and things like that?

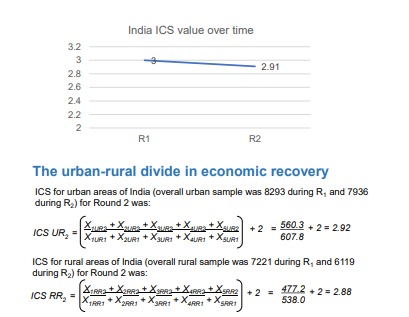
The computation indicates that there was a slightly higher divergence in ICS scores in rural areas as compared to urban. This is perhaps better understood by looking at the raw scores across each of the five indicators used for the construct of the index. The details are as follows
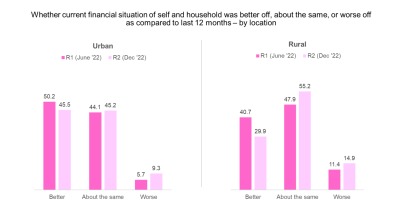
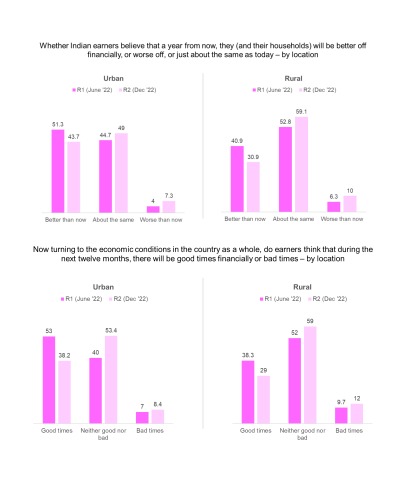
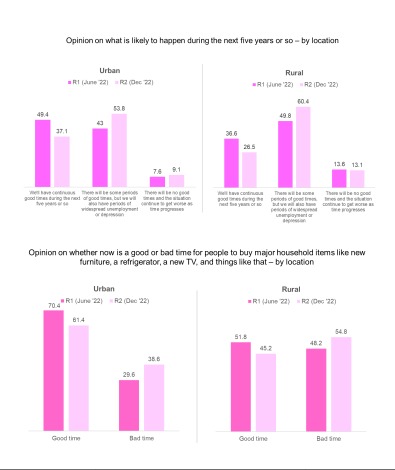
As the above diagrams indicate, consistently across all the five indicators used for measuring ICS, there has been a notable dip in positive scores (expressed as percentage of respondents) and a commensurate rise in negative scores across the two rounds of the survey.
Overall conclusions
Given that 2021 was a tough year in terms of COVID-related disruptions, close to half of the earners had confirmed that there has been some sort of economic recovery during the Round I of the survey in June 2022. However, the recovery was higher in urban areas than in rural. What is more important is that Indians, after having undergone the harshness of pandemic-led closure and loss of economic opportunity, were extremely upbeat about their future prospects and this was reflected in the R1 results. In R1 , the comparison was between 2021 and the first half of 2022, and hence the results came extremely positive.
However, in R2 , a lot of these expectations seem to have fallen through. The optimism displayed in R1 has been eroded to quite an extent in R2 given that the year has been marked by retail price rise and no major breakthrough in the job nvironment. The negativity that has crept in is more pronounced in the rural areas, among the younger earners, and certainly among the workers who belong to the lower end of the income spectrum