
The Cox Model: The Idea and Application in Survival Analysis
14
Nov
Posted by: Kultar Singh
Category:
Research and M&E
No Comments

Survival analysis is an optimal tool for examining time data to an event type. The methods for survival analysis can be used to evaluate multiple risk factors simultaneously, like in the case of multiple linear or multiple logistic regression analyses. A well-known regression method for survival analysis includes the Cox Proportional Hazards model (Cox model), utilized to study the impact of various variables on the amount of time for which a particular event occurs.
Created by D.R. Cox in 1972 to deal with categorical and predictor variables, the Cox model is a prediction model that analyzes time-to-event information. Also called the Cox Regression, the Cox model is employed to investigate the relationships between the event’s outcome at the time variable Y and predictor variables X1, X2, …, Xz.
Assumption
The elapsed time values are defined by two characteristics that make them invalid for traditional statistical methods such as t-tests and analysis of variance and multi-regression.
In the first place, the values of time are usually significantly distorted. The standard statistical methods require that the data be distributed normally. While a transformation can correct this skewness, choosing a more real data distribution is more straightforward. The other issue with survival information is that some data is restricted, i.e., a particular observation is censored when the final point hasn’t been reached by the time the subject has been taken out of the study. It could be that the study was completed before the subject’s response was observed, or the subject resigned from participation, or it could be because the subject passed away.
There are several essential factors when applying the Cox model. It is based on two assumptions. The primary one is that survival curves of different strata need to contain hazard factors that are proportional to the time t. The second is that the relation between the log hazard and each dependent variable is linear.
Cox Proportional Hazards Regression Model
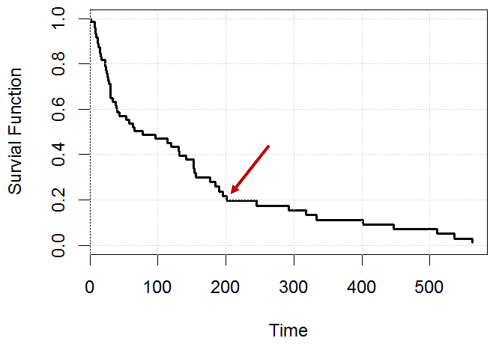
To explain the construct further, on the x-axis, one can have the number of days, wherein on the y-axis, we can estimate the percentage/ proportion of population subjects who “survived” that period. Though importantly, survivorship analysis is complicated because some participants’ “death” is not witnessed, and subjects may still live. In this scenario, the impact measurement in the Cox model is the risk rate which is the probability of failing. The probability of failure is the chance of suffering from a particular event when the individual has lived for a certain period (a probability should fall within the range of 0-1). The outcome parameter, which can be described as a hazard, measures the likelihood of certain events, such as death before the time t. In the end, the group’s hazard may be higher than 1. For instance, if the risk is 0.4 at the time t and the units of time comprise months, on average, 0.4 events are expected per risky person per month.
The Cox model is written in the following manner:
h(t)=h0(t)exp(b1X1+b2X2+…+bpXp),
In this equation, h is the anticipated hazard at time t, and h0(t) is the baseline hazard when all predictors are equal to 0. It is important to point out that the expected hazard (h(t)) or the likelihood of suffering from the incident of interest in the immediate future is the result of the baseline risk (h0(t)) and the exponential function of the linear mixture of the predictors.
Risk and Hazard-Ratio
In analyzing survival data, the two main functions are of primary significance: the survivor function and the function of hazard.
The odds ratio used in multiple logistic regression analysis is equivalent to the hazard ratio (HR). It is the proportion of all observed occurrences to all predicted events in two comparison groups that are unrelated. The likelihood of dying between time 0 and t is a cumulative hazard at time t, whereas the probability of living to time t is known as the survival function at time t.
In addition, Cox regression’s coefficients are related to risk—a positive coefficient denotes a worse prognosis, whereas a negative value represents a protective effect of the associated variable. The risk ratio of one indicates that risk is equal for all subjects, whereas lower than 1 shows less risk. A risk ratio higher than 1 indicates increased risk.
It is possible to use this to calculate the rates of infant mortality (IMR) or the maternal mortal rate (MMR).
Kultar Singh – Chief Executive Officer, Sambodhi