India rural population for 2021 was 909,384,77, i.e., 64.64% of India lives in rural areas. This is much more than the combined population of Europe and Australia. According the NITI Aayog’s Multidimensional Poverty Index, while 25.01 per cent of the population was multidimensionally poor in the country, the poverty ratio was as high as 32.75 per cent in rural areas during 2015-16
(NFHS V, which data was used for the construct of the index). This was against 8.81 per cent of the population in urban areas. Urban areas have seen a major development in the last two decades, but rural areas haven’t been able to keep up. Rural India is still facing issues like poverty, low literacy rates, and lack of basic infrastructures like schools and hospitals, all leading to youth migrating to urban areas in search of new opportunities. The simple truth is, if rural areas are poor, India is poor.
The rural sentiment: Not so upbeat, but hopeful!
As a planned response strategy, the Prime Minister Shri Narendra Modi has revealed a unique roadmap for the country for the next 25 years. The objective of Amrit Kaal is to enhance the lives of the nationals of India, reduce the divide in development between villages and cities, lessen the government’s interference in people’s lives and embrace the latest technology. In line with this vision, the Budget has laid an ambitious foundation for India @100 by making unprecedented allocations for the development of the rural areas.
As India moves towards a more digital and interconnected economy, it’s important to understand how consumer sentiment is evolving in rural India. One way to measure rural consumer sentiment is through the Consumer Sentiment Index (CSI), a tool that can help us understand how rural consumers are feeling about the economy and their own financial situation.
Sambodhipanels has recently come out with the second round of Index of Consumer Sentiment from the survey conducted in December’22. The survey covered 7221 rural respondents in Round 1 (June’22) and 6119 rural respondents in Round 2. The survey follows the methodology of Michigan University’s survey of consumers which they have been carrying out in the US since 1972.
Rural India being a vast, diverse landscape and home to a significant portion of India’s population, is a fascinating case study in itself. In order to have a close look at how sentiments of the rural consumers have changed from Round 1 to Round 2 of the survey, the rural data was first weighted based on income classes, as follows:
• Rural relatively upper income group = 5%
• Rural relatively middle-income group = 30%
• Rural relatively lower income group = 65%
NB: Proportions based on MRUC new SEC distribution and ICE 360 estimates brought out by PRICE.
Let us have a look at the change in values of some of the key indicators that define the state of rural consumer sentiment.
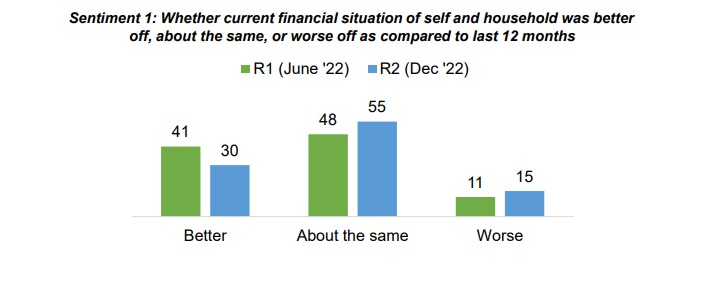
As one can see, between the two rounds there has been a clear drop (9 percentage points) in the proportion of rural respondents who believed that their financial situation has become better as compared to the last 12 months. It may be noted that the reference period of last 12 months include the 6 months that divide R1 and R2 . Conversely, there has been an increase of 4 percentage points among people who felt their condition had deteriorated. On the brighter side, there are still more people in rural India who felt that their situation has improved (30%) as against those who felt their situation has worsened (15%).
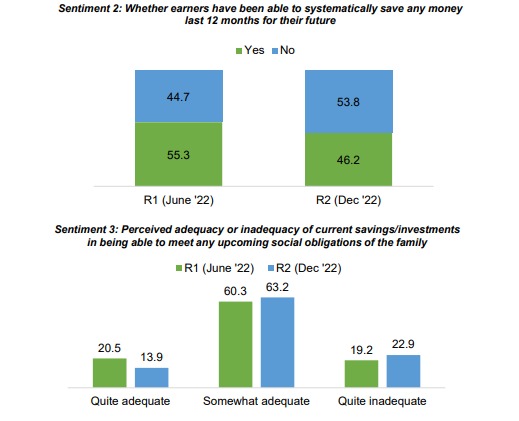
This phenomenon of downward trend in financial well-being is backed by a decrease in the proportion of systematic savers from R1 to R2 . When asked if they have been able to systematically save any money in the last 12 months for their future needs, 46% of respondents from R2 replied positively, as compared to 55% of them from the last round. And those who did save, found their savings to be inadequate to be able to meet any upcoming social obligations of the family. The inadequacy of savings has also increased by 7 percentage points over the two rounds.
We have looked at perceived financial stability when compared to the past 12 months, and how it has impacted not only savings propensity but also perceptions regarding adequacy of savings behaviour towards meeting upcoming social obligations. In terms of consumer sentiment, it is also important to look at whether consumers are optimistic or pessimistic about the future.
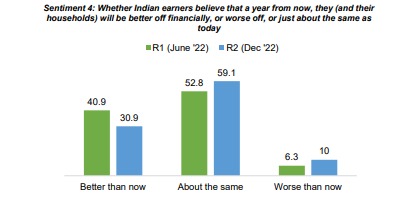
Here we see that there has been a ten percentage points drop in the proportion of participants who had felt that their financial situation a year down the line would be better that today. Corollary to this, there has been a near-six percentage point escalation in the proportion of respondents who felt that they are likely to be worse off than they are now a year forward. This goes to show that the buoyancy in optimism which was displayed during Round 1 as the country was bouncing back from the pandemic induced recession has been somewhat toned down or even eroded and further 6 months into the year.
However, by juxtaposing proportions for Sentiment 1 and Sentiment 4 we can see that in absolute terms shows how consumers are more hopeful of a better tomorrow. While 15% of the survey participants in rural India were of the opinion that their financial situation was worse off today as against 12 months ago, only 10% expected that they will be worse off 12 years down the line.
Going beyond personal finances, the survey also explored how the average rural resident feels about the economic future of this nation.
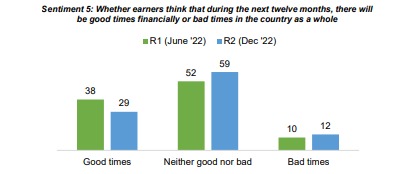
The data from the two rounds point to the fact that the rural consumer have tempered their expectations between the two rounds. There was a nine percentage points drop in the proportion of people who felt that the country would experience good times in the next twelve months between R1 and R2 . However, most of those who had changed their position had indicated that they expected the economy to remain neither good nor bad and not become worse than today. Once again, at an aggregate level there were more people who expected good times to come as against bad times, which perhaps indicates a certain degree of optimism.
The data from the two rounds point to the fact that the rural consumer have tempered their expectations between the two rounds. There was a nine percentage points drop in the proportion of people who felt that the country would experience good times in the next twelve months between R1 and R2 . However, most of those who had changed their position had indicated that they expected the economy to remain neither good nor bad and not become worse than today. Once again, at an aggregate level there were more people who expected good times to come as against bad times, which perhaps indicates a certain degree of optimism.
Sentiment 6: Opinion on what is likely to happen to the Indian economy during the next five years or so
In R2 , 27% though that there will be continuous good times during the next five years as against 36% in R1 .
In R2 , 60% thought that there will be some periods of good times, but there will also be periods of widespread unemployment or depression. This proportion was 50% in R1 .
In R2 , 13% of the people thought that there will be no good times and the situation will continue to get worse as time progresses. This proportion was 14% in R1 .
The confidence in the economy has decreased over the two rounds. This is backed by majority of respondents not being so optimistic about the economic outlook as earlier 50% and now 60% population thinks that we will have periods of good times interspersed with unemployment or depression, while the proportion with barely any hopes was almost consistent with a drop of just one percentage point. These responses show the sensitivity of people’s perceptions to the
changing economic conditions in the country.
Their confidence in ability to retain their current source of income and meet regular monthly household expenses in the next 3 years without having to compromise any current levels of consumption displays a similar reflection.
Sentiment 7: Extent of confidence in ability to retain one’s current source of income in the next 3 years
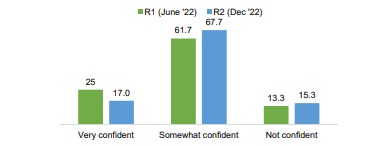
There is a decrease in the percentage of respondents who reported feeling very confident about retaining their current source of income, from 25% in R1 to 17% in R2 , with a corresponding two percentage point increase among those not being confident about it.
Sentiment 8: Expected ability to meet regular monthly household expenses in the next 3 years without having to compromise any current levels of consumption
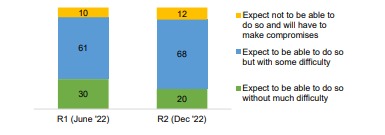
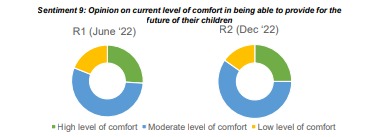
At the same time there was a decrease in the percentage of respondents from 29.5% in R1 to 20% in R2 who expected to be able to meet regular monthly household expenses in the next 3 years without having to compromise any current levels of consumption. Conversely, there was an increase of seven percentage points of respondents who expected to be able to do this with some difficulty, from 60.9% in R1 to 68.1% in R2 People are quite sensitive when it comes to their children, and when it is about providing for a decent future for their children, they know their truest abilities. This specific question had responders moving from extreme confidence levels to a middle state. There are less confident people from 25% in R1 to 23% in R2 who think they can provide for a decent future, and there is also less percentage of those who think they can’t. This proportion has fallen from 18% in R1 to 14% in R2. The ‘somewhat confident’ bucket is the dominant response now. This category has grown from 56% to 64%.
This uncertainty was also reflected in the fact that majority of the survey participants expressed caution when it came to making capital expenditures (on household items as well as durables). The survey results are given below.
Sentiment 9: Opinion on whether now a good or bad time for people is to buy major household items like new furniture, a refrigerator, a new TV, and things like that.
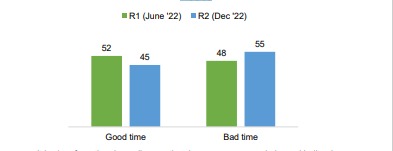
It is clear from the above diagram that there are more people in rural India who advised caution regarding spending on household white goods in R2 than there were in R1 . In absolute terms as well, 55% of the respondents from the December round had opined that it was a bad time to be spending on white goods, up 10 percentage points from the June round.