
Regression Discontinuity: Design and Approach
07
Jul
Posted by: Kultar Singh
Category:
Research and M&E
No Comments

Regression Discontinuity Design is a quasi-experimental design and another way to deal with selection bias. One can use it when it is possible to establish a cut-off level for access to treatment and treatment status is determined based on observable characteristics. A treatment group is formed to have units that meet the eligibility criteria of the intervention. The control group consists of units below the threshold but do not have access to the intervention. It can be assumed that the control and treated groups are similar according to most criteria. Therefore, a small difference in variables granting access would not justify a different outcome variable and a difference in the latter could be entirely attributed to the treatment.
The basic RD design is a pretest-posttest design with two groups. Pretest-posttest refers to administering the same measure before and following an intervention or programme. Participants are assigned to the programme or the comparison groups based on one pretest score. RD is used frequently in the evaluation of a policy’s effect. One can evaluate it by comparing the non-treated and treated groups at the margin. The contour of the threshold reduces bias and creates a randomization situation.
The methodology must have two conditions. First, it must be continuous to rank the population of interest. This could be an age or poverty index. Establishing a threshold index above or below the level at which the population is eligible for the programme is also necessary.
Types of Regression Discontinuity:
There are also two types of Regression Discontinuity. The first one is known as sharp discontinuity. It is used when treatment is given according to a specific cut-off point. All that are eligible receive treatment. This ensures that the treatment is only available to eligible participants. To calculate the treatment’s effect, a simple comparison is necessary.
The second type is fuzzy discontinuity, which is used when some eligible individuals fail to receive treatment and/or are ineligible to receive it. In essence, the treatment status of the fuzzy discontinuity type does not change from zero to one when individuals become eligible or ineligible. It is essential to point out that the fuzzy version is utilized more often in practice.
Estimation and Analysis
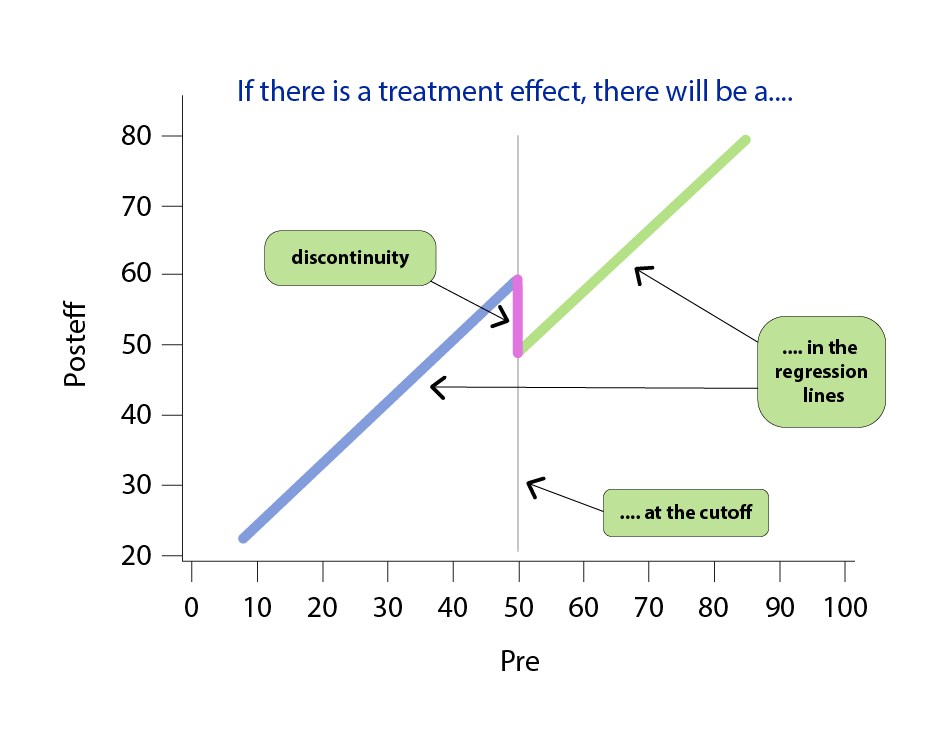
All RD analyses should start with a graphical presentation. The vertical axis shows the outcome value for each data point, while the horizontal axis shows the rating. The graphical presentation gives a strong visual answer to whether there is evidence for a discontinuity in an outcome at the cut-off point. In addition to graphical analysis, methodologists recommend testing many functional forms, including quadratic models with treatment interaction and linear models with a treatment interaction for the analysis and estimation. They also suggest using non-parametric estimation techniques like local linear regression to ensure that the functional form specified is as close to the correct form as possible (van der Klaauw (2008) and Cook (2008).
References:
Card D. and Shore-Sheppard L. D. (2004) ‘Using Discontinuous Eligibility Rules to Identify the Effects of Federal Medicaid Expansions on Low-income Children’, Review of Economics and Statistics 86(3): 752– 766
Cook, Thomas D. 2008. “‘Waiting for Life to Arrive’: A History of the Regression-Discontinuity Design in Psychology, Statistics and Economics.” Journal of Econometrics, 142(2): 636–54
Imbens G. W. and Angrist J. D. (1994) ‘Identification and Estimation of Local Average Treatment Effects’, Econometrica 62(2): 467– 476.
Imbens G. W. and Lemieux T. (2008a) ‘Special Issue Editors’ Introduction: The Regression Discontinuity Designs — Theory and Applications’, Journal of Econometrics 142(2): 611– 614.
Imbens G. W. and Lemieux T. (2008b) ‘Regression Discontinuity Designs: A Guide to Practice’, Journal of Econometrics 142(2): 615– 635.
Van Der Klaauw W. (2008) ‘Breaking the Link between Poverty and Low Student Achievement: An Evaluation of Title I’, Journal of Econometrics 142(2): 731– 756.
Kultar Singh – Chief Executive Officer, Sambodhi