
P Value: Meaning, Interpretation, and Significance
30
Sep
Posted by: Kultar Singh
Category:
Research and M&E
No Comments

The meaning of the probability value (P-value) is a critical topic in statistics. It is a numerical representation of the likelihood that your data resulted from chance or that the null hypothesis is correct. When we analyze data using Excel or any other statistical software application, one of the essential outputs is the p-value or significance. It helps determine your data’s importance in relation to the null hypothesis.
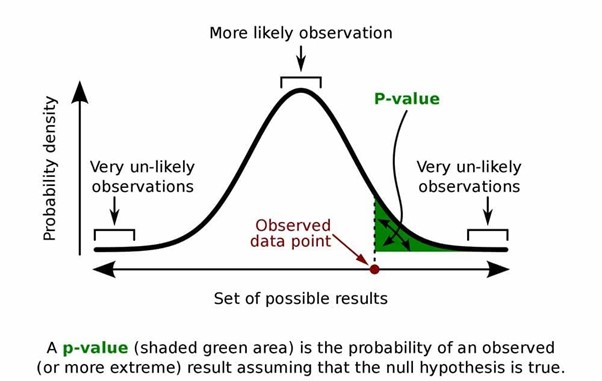
The p-value reflects the likelihood that if the null hypothesis is true, sample variation will result in an estimate farther from the hypothesized value than our data estimate. Simply put, it reflects the chance of receiving this result if the null hypothesis is true.
To detail it further, let’s start with the null hypothesis.
The null hypothesis says that the two variables under study do not correlate and that the results are attributable to chance. The alternative hypothesis claims that the independent variable did influence the dependent variable and that the results are important in verifying the researched theory. If it is found that the null hypothesis is rejected, then the researcher can accept the alternative hypothesis.
The p-value and statistical significance
A p-value between 0 and 1 is frequently used to indicate statistical significance—the more evidence against accepting the null hypothesis, the lower the p-value. A p-value less than or equal to 0.05 is termed statistically significant in social sciences, which means the probability that the null hypothesis is correct is less than 5%, indicating considerable evidence against it and that the outcomes are random. We, therefore, reject the null hypothesis and accept the alternative.
Further, our initial hypothesis is probably correct if the p-value is large. The null hypothesis does not fail to be rejected. It is known as a non-significant result, i.e., a p-value larger than 0.05 indicates that the null hypothesis is strongly supported and is not statistically significant.
P-value: Interpreting the value
Although p-values are presented as decimals, changing them to percentages may facilitate comprehension. For example, a p-value of 0.0248 translates to 2.48 percent. This suggests that your results have a randomness probability of 2.48 percent, i.e., it happened due to chance and can be considered trivial. A significant p-value of .8, i.e., 80 percent, suggests an 80 percent possibility that your results are completely random and unrelated to the experiment. The smaller the p-value, the more significant your results.
Conclusion
The p-value reflects whether the sample indicates the existence of an effect in the population. The presence of an effect is shown by a p-value less than 0.05. If the p-value is greater than 0.05, there is no effect. Occasionally, significance levels above 0.05 are employed, but 0.05 is considered https://ergoterapija.lv/registreties the standard in social sciences.
Kultar Singh – Chief Executive Officer, Sambodhi